


Some thoughts on the Laramie Reporter’s 2024 Election Coverage Survey results
Thank you to everyone who took the time to tell us what you’d like to see this election year. In this post, I’ll break down some of the survey’s findings and make a promise or two.

We have about five and a half months until the 2024 General Election, and significantly less than that until the primary. Here at the Laramie Reporter, we’re gearing up to interview candidates, dig into platforms and analyze the stakes, all in the service of providing you with the information you need to be an informed voter.
If you took part in the Laramie Reporter’s 2024 Election Coverage Survey this week, you’ve helped direct our attention to what our readers want to see and your input will improve our coverage of what promises to be an interesting and impactful election year.
We kicked off this year’s coverage by breaking the news that Laramie Mayor Brian Harrington is seeking a spot on the Albany County Commission. Candidates have now officially started filing to run and we’ll soon be able to report on even more races.
If you’ve ever found yourself in a polling booth, finger or pencil hovering over a bubble, feeling like a bad citizen because you can’t recognize half the names running for school board, I know exactly how you feel. I’ve been there too.
Our fellow citizens increasingly find themselves in the same boat, forced to make important decisions on limited information, biased information, or no information at all.
It doesn’t have to be like this.
Throughout the next five and a half months, I hope we can build a database here on this site, compiling information about every candidate and item you’re likely to see on your ballot so that when you fill that sucker out, you know who you’re voting for and what they stand for.
It won’t just be data though. We hope to bring you all of the information you need in well-sourced, well-written, deeply researched reporting about what’s at stake and about what factions or funders are influencing our candidate pool. We’ll also endeavor to explore what various election outcomes will mean for the issues that matter most — something many of you asked for in this survey and in your comments.
Thanks to those of you who took this survey, we have a better picture of which issues matter to our readers and what kinds of research you’d like to see us do.
(You were also very kind, and the words of encouragement and gratitude in the open-ended section were wonderful to read. We will indeed endeavor to “keep up the awesome, nuanced, and thoughtful reporting,” as one respondent directed.)
So without further ado, I’d like to share some of the results of this survey and note how we’ll work to fulfill our readers’ wishes.
Who took this survey?
In total, we had 42 respondents. Each respondent had to be a subscriber to the Laramie Reporter, but did not have to be a paying subscriber.
We asked only a few demographic questions, so it’s not clear what the sex/gender or race/ethnicity makeups of our respondents were. But we can report that a majority of respondents were between the ages of 35-54 (55%), only five respondents were younger than this, and no respondent was under the age of 25.
When it came to political affiliation, respondents were most likely to be Democrats (48%) or Republicans (36%), although some were Independent (7%). About 10% of respondents selected “I prefer not to say.”

How do respondents plan to vote?
Perhaps unsurprisingly, almost all respondents in the 2024 Election Coverage Survey said they plan to vote in the General Election (98%), while an overwhelming majority plan to vote in the Primary Election as well (90%).
Perhaps surprisingly, more than two-thirds of all respondents said they plan to vote absentee or early (69%) while less than a third of respondents said they plan to vote on Election Day itself (31%).
Most respondents planned to vote in most races:
Federal (President): 95%
Statewide (U.S. Senate and U.S. House): 95%
State House (HD-13, HD-14, HD-45 or HD-46): 95%
Albany County Commission: 95%
State Senate (SD-10): 90%
Laramie City Council: 88%
Albany County School Board: 86%
Only 38% said they plan to vote in special district elections.
While the Laramie Reporter’s coverage will focus on state house, state senate, county commission, city council and school board elections, there might be room to also examine the statewide and federal elections. While these elections exist beyond the county line, they will certainly have ramifications for the people living here and it might be worth digging into what a Biden Administration or a Trump Administration could mean for Albany County.
These results also tell me that I should approach special districts with a mind to education. For example, what is the Albany County Hospital District? What falls under its mandate? What are its powers? I don’t have a complete answer ready to share with you, so we could learn together.
There are other races we ought to explore together as well. For example, why do we vote to retain judges, but not elect them? And which judges will appear on your ballot this year? There will be fewer overall races this year than there were in 2022 so we might indeed have time to address everything before your deadline to vote.
What issues do voters care most about?
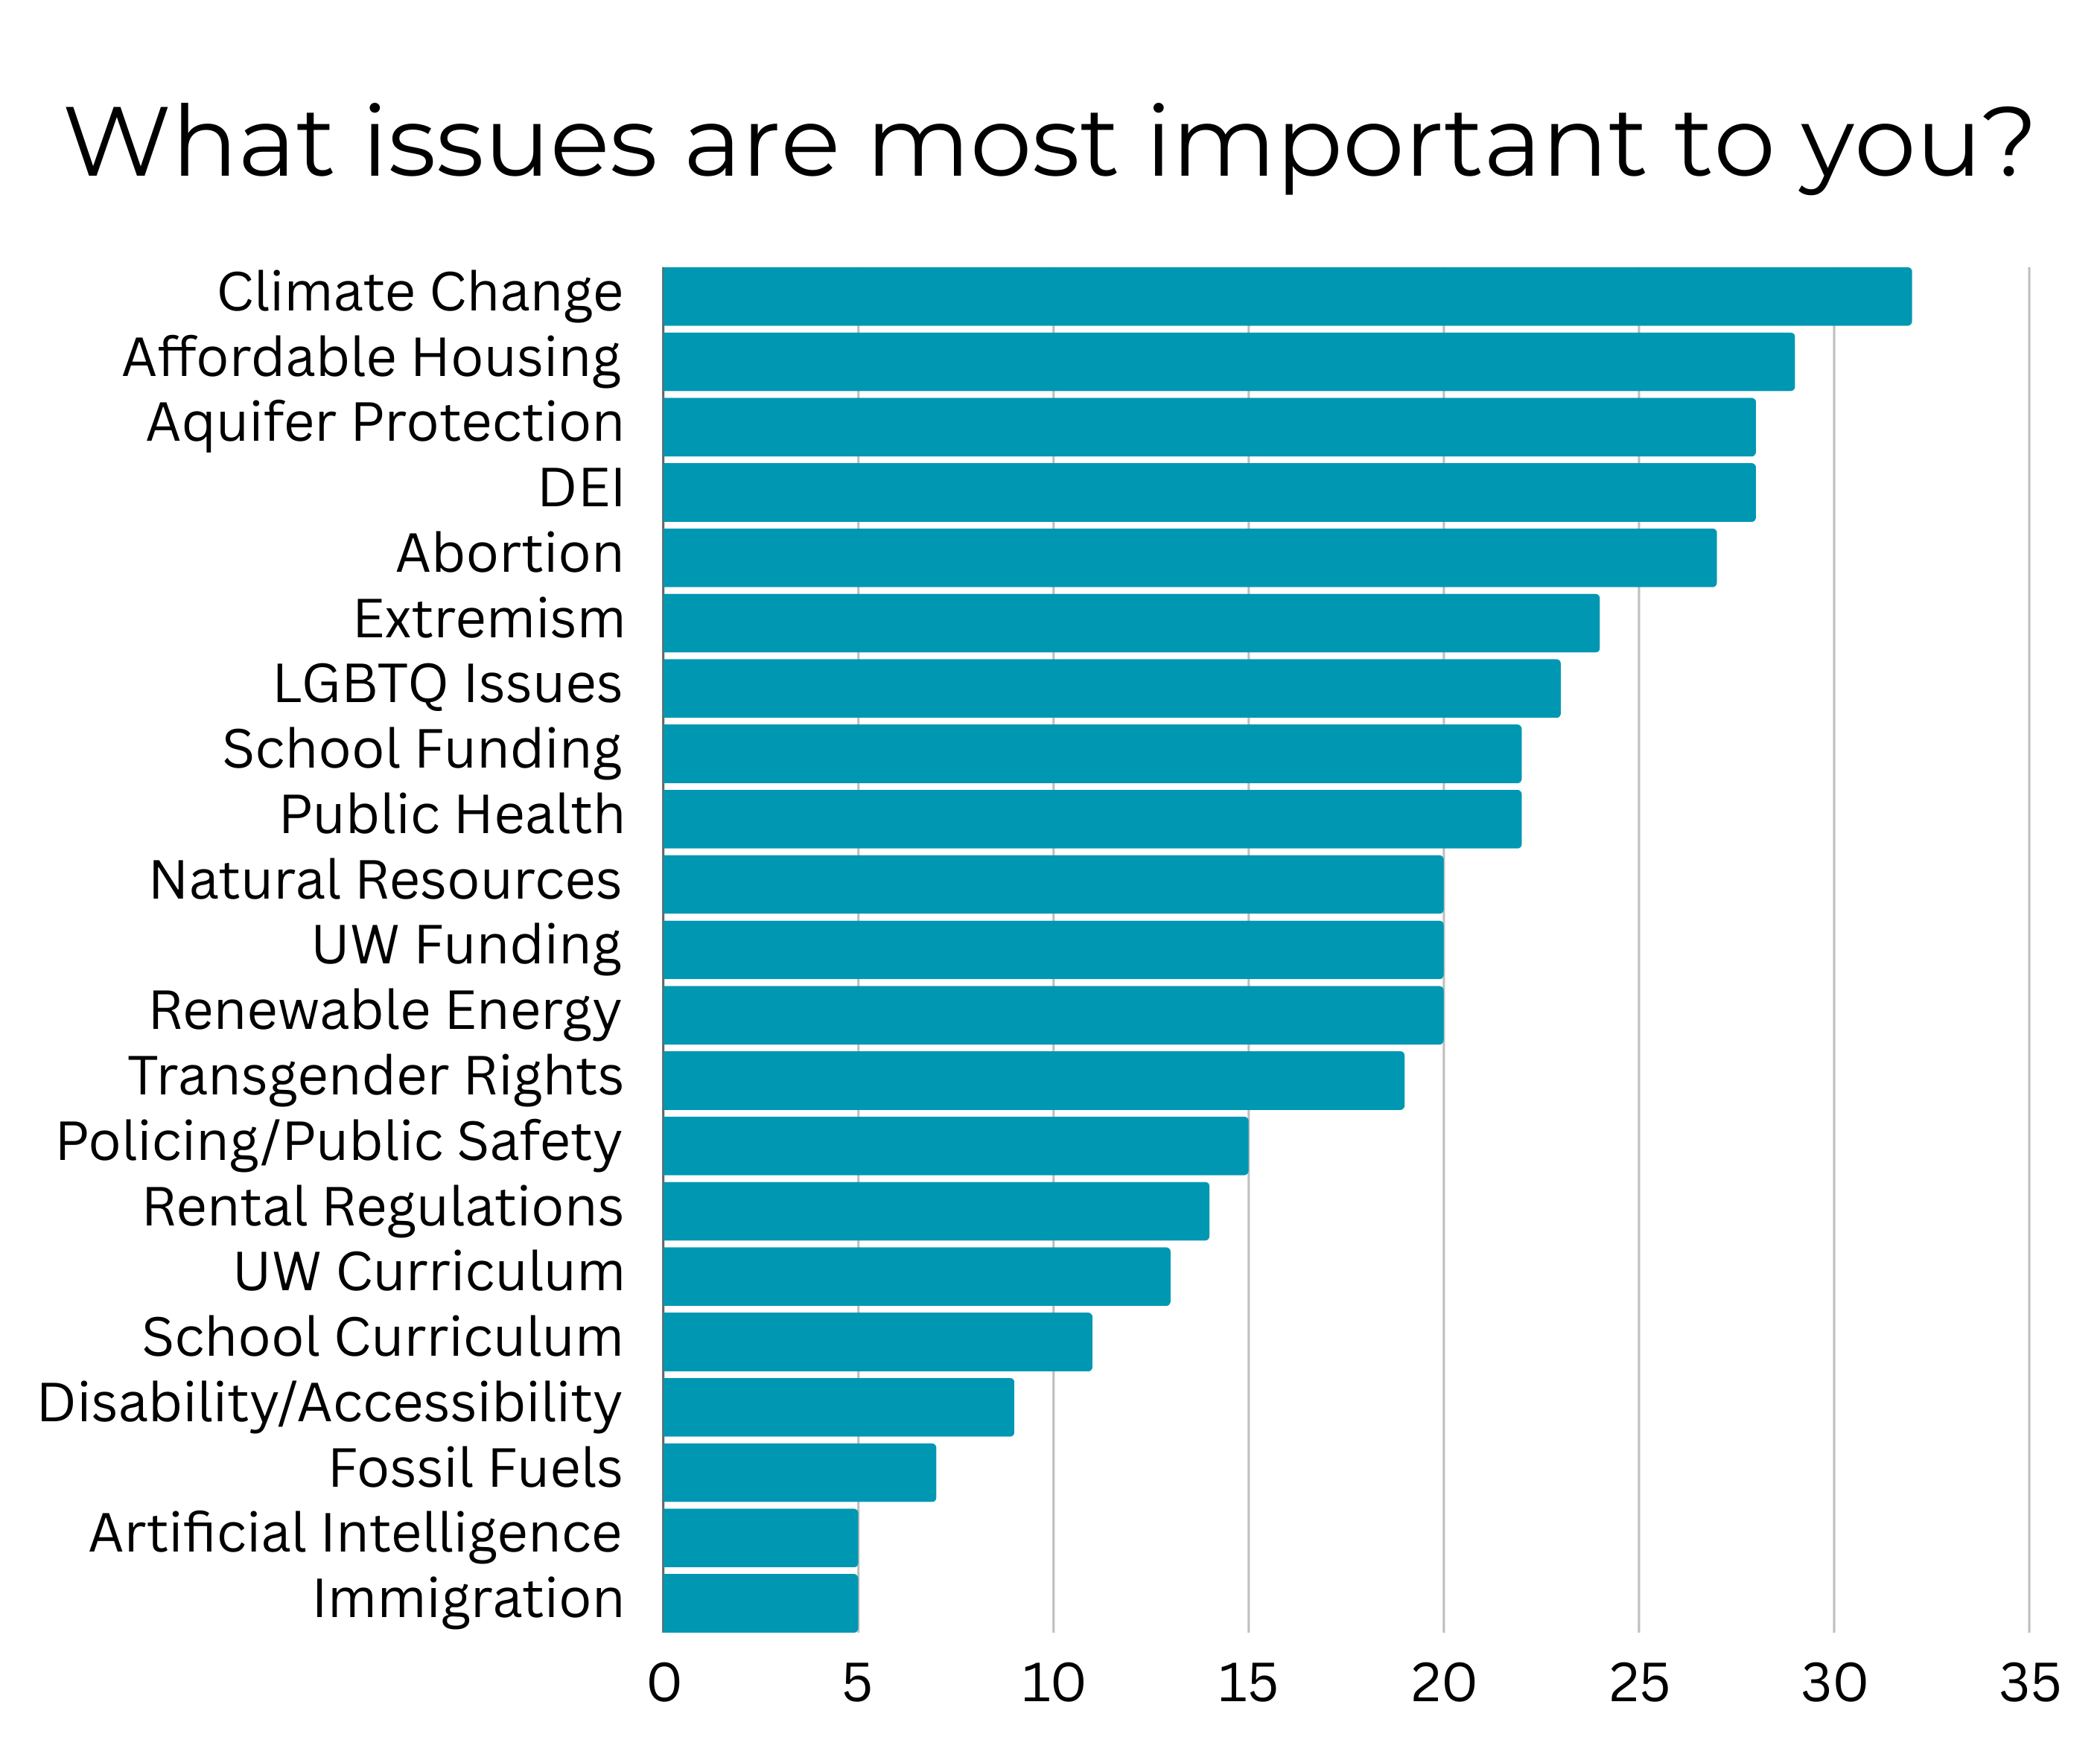
Respondents were given a list of 21 issues that could play a role in this year’s election and were asked to select those most important to them. The issues deemed important by more than half of respondents were:
Climate Change: 76%
Affordable Housing: 69%
Aquifer Protection: 67%
Diversity, Equity and Inclusion: 67%
Abortion: 64%
Extremism: 57%
LGBTQ Issues: 55%
School Funding: 52%
Public Health: 52%
What kind of coverage would Laramie like to see?
Respondents would like to see issue-focused coverage (90%), including stories “exploring how the candidates differ on a topic relevant to the office they seek, such as looking into how the city council candidates differ on housing,” and stories examining the stakes of various electoral contests (69%).
“[Your reporting] has been great in the past but really like the idea of some more issues/outcome based reporting,” one respondent noted in the open-ended section.
I really like this idea too and I’m glad the people want to read it because I want to write it. I think the most useful stories I wrote during the 2022 election were those examining the differences between school board candidates or analyzing the possible outcomes of the city council races. You can expect more coverage of that variety in 2024.
Respondents would also like to see candidate interviews (71%), candidate surveys (69%), candidate features (67%) and election results (62%).
“Short candidate Q&As are easy to absorb and share with others,” a respondent added.
Only about a third of respondents were interested in seeing stories about campaign fundraising (38%), campaign spending (38%), campaign event previews (33%) or campaign event coverage (31%). And only a quarter were interested in seeing articles about how to vote or get involved (26%) or articles about election security or election procedures (21%). The least popular coverage on offer was reporting live election results via Twitter (14%).
Next time I run a survey like this, I plan to include some way for you to tell me what you DON’T want to see. I am realizing now, with survey results in hand, that I cannot appropriately interpret some of these results without that information.
For example, only 14% said they would like to see live election results via Twitter. That could be because only 14% or so are on Twitter, or it could be that 86% of respondents believe posting live election results on Twitter could have negative consequences, like giving people the wrong impression before all the precincts are in. So I’m left not knowing whether I should post these results as I’m watching them come in on Election Night for the minority of my readership who might really value getting the news that way, or if I ought to refrain from doing this because my readership is actively opposed.
Live and learn I guess, but please nobody tell my former thesis advisor of my poor survey design.
About 45% of respondents said they would like to see the Laramie Reporter host a candidate panel or debate, while another 43% said they would “maybe” like to see that. Only 12% said “I’m not sure” and not a single respondent said “No.”
I would like to host or take part in such a debate or panel, or multiple debates or panels. As it stands, I don’t have the resources at the moment to host such an event on my own, but I will look into partnerships that might allow this to happen. During the 2022 election, I moderated a debate between candidates for sheriff and a debate between candidates for county clerk which were both hosted by the University of Wyoming Political Science Club. I’d love to do that again.
While only a third of respondents said they would like to see campaign event previews, I’ll try to let you know when a League of Women Voters forum is coming up.
As for the quantity of election coverage, 43% of respondents said they would like to see 1-2 stories a week, while 26% requested 3-4 stories a week.
We’ll see what we can do. As one respondent kindly wrote in the open-ended section: “Would love to see 3 or 4 articles a week, but also do not think that is sustainable from a quality / quantity standpoint and current staff levels.”
Too true. But if our coverage manages to get through the entire ballot before Nov. 5, I’ll consider that a success.